
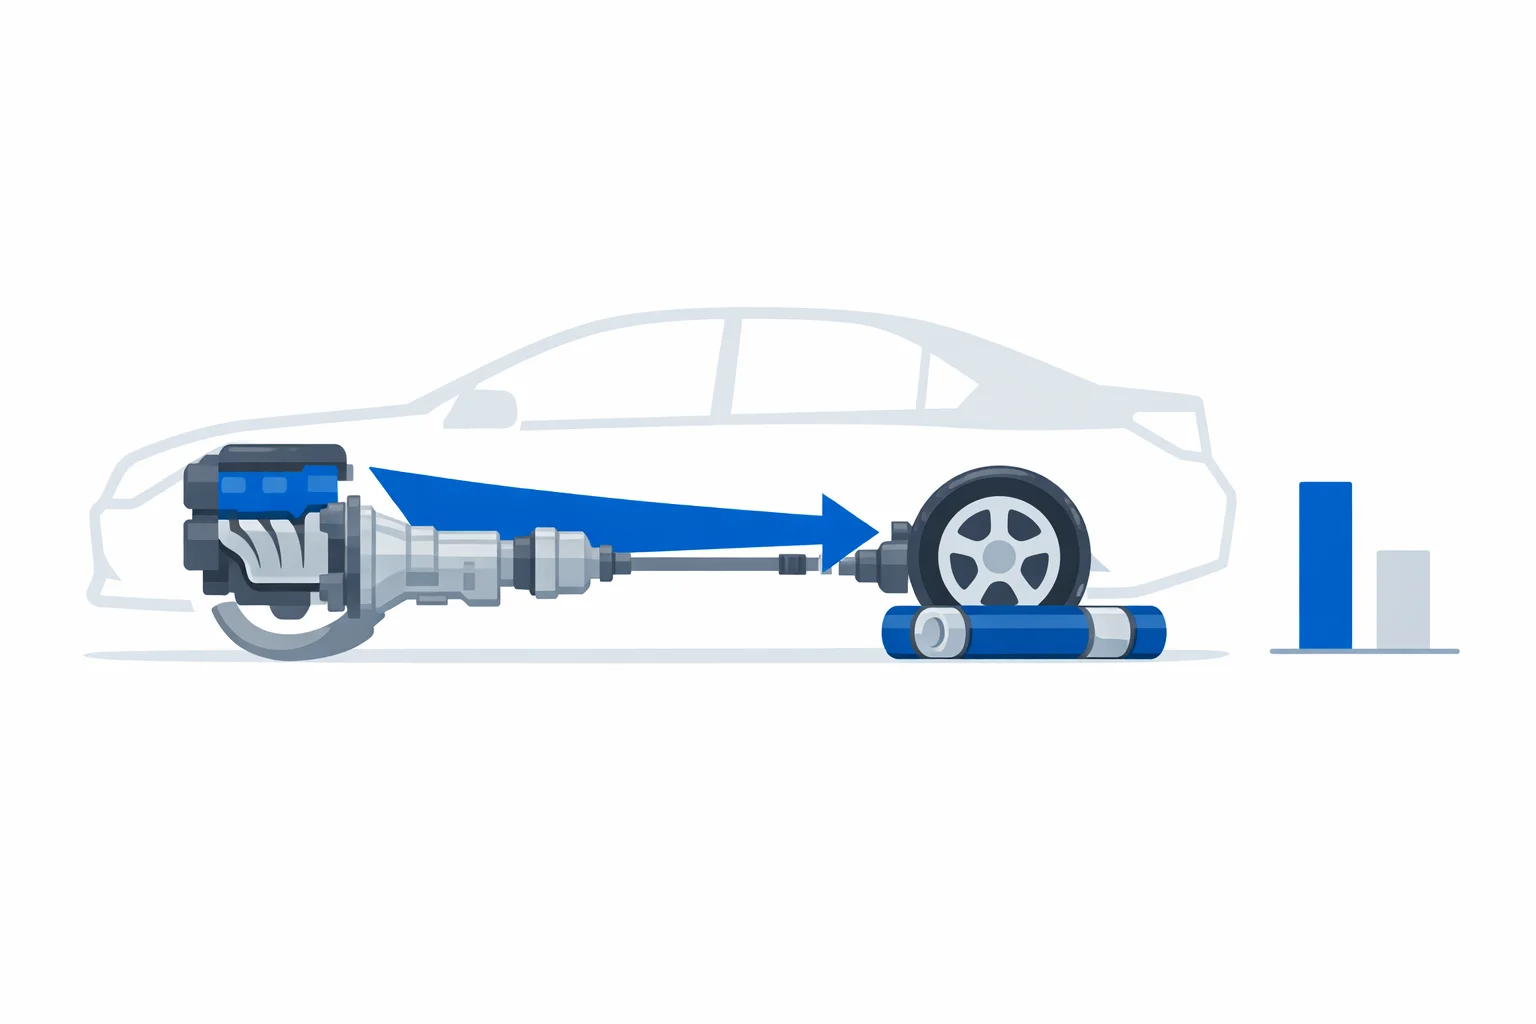
A drivetrain loss calculator earns its keep in the thirty seconds after the dyno operator hands you the printout. The sheet reads 285 whp. The window sticker on the same car says 335. Nobody stole fifty horsepower — it simply never made it past the gearbox, the driveshaft and the ring gear, and the two numbers were never measured in the same place to begin with.
Where Did Those 50 Horsepower Actually Go?
Manufacturers rate engines on an engine dyno, bolted to the crankshaft flange with no transmission attached. A chassis dyno reads at the roller surface, on the far side of the clutch, the gearbox, the driveshaft, the final drive, the axles, the hubs and the tyres. Every one of those takes a cut, and the US Department of Energy's energy breakdown for gasoline vehicles puts driveline losses among the larger parasitic drains on a car in motion.
Here's how our 50 hp splits up on a rear-drive manual car, and one of these line items surprises almost everybody:
| Where it goes | Typical share | Why |
|---|---|---|
| Hypoid ring and pinion | 4–6% | The pinion sits below the ring gear centreline, so the teeth slide as well as roll. The worst gear mesh in the car. |
| Gearbox, non-direct ratio | 2–4% | Two meshes at roughly 1–2% each. A 1:1 gear locks input to output and bypasses the countershaft entirely. |
| Rotating inertia during the pull | 3–5% | Not friction at all — energy spent spinning up wheels, tyres, driveshaft and flywheel while the dyno sweeps. |
| Oil churn and seal drag | 1–3% | Stirring a sump of 75W-90. Highest on a cold axle, which is why the first pull reads low. |
| Bearings, U-joints, tyre deformation | 1–2% | Small individually, and the tyre squirming against the roller is the least repeatable of the lot. |
The inertia row is the one worth arguing about. On an inertia dyno, a chunk of what gets called "drivetrain loss" is the engine accelerating its own rotating mass, and it vanishes the moment the car holds steady speed. Fit a set of 22 lb wheels in place of 16 lb ones and the same engine will read several horsepower lower without a single extra gram of friction anywhere. It also explains the hypoid line: front-drive cars don't have a hypoid final drive at all — the ring gear lives in the same case as the transmission and meshes on-centre — which is most of the reason FWD sits at 10% while RWD sits at 15%.
Divide by 0.85. Don't Multiply by 1.15.
The correction runs in both directions and it is short:
crank hp = wheel hp ÷ (1 − loss)
wheel hp = crank hp × (1 − loss)
Our 285 whp car at 15% is 285 ÷ 0.85 = 335.3 hp. Now do it the way half the internet does it, by adding 15% back: 285 × 1.15 = 327.8 hp. That's 7.5 hp of pure arithmetic error, and it always errs low. The reason is that the percentage is measured against the crank figure, not the wheel figure — you are recovering a fraction of a total you don't have yet, which is division, not a markup.
The gap widens fast with the loss figure. Run the same 285 whp as an automatic AWD car at 22%: multiplying gives 347.7 hp, dividing gives 365.4 hp. That's 17.7 hp lost to a keystroke. Torque takes the identical factor, because power and torque differ only by engine speed and the drivetrain doesn't change RPM between the two measuring points — the horsepower from torque calculator handles that side of the relationship. So 290 lb-ft at the wheels becomes 341 lb-ft at the crank, using the same 0.85.
What Loss Percentage Should You Actually Use?
These are the conventions dyno shops quote, and the ordering follows the hardware: count the gear meshes, then ask whether one of them is a hypoid, then ask whether a torque converter and a second driven axle are involved.
| Layout | Loss | 285 whp becomes | What drives the figure |
|---|---|---|---|
| FWD manual | 10% | 317 hp | No driveshaft, no hypoid, shortest path in the business. |
| FWD automatic | 12% | 324 hp | Adds converter slip and a hydraulic pump to drive. |
| RWD manual | 15% | 335 hp | The hypoid rear end is most of the difference from FWD. |
| RWD automatic | 17% | 343 hp | Hypoid plus converter. The classic muscle-car setup. |
| AWD manual | 20% | 356 hp | Centre differential and a second axle to turn. |
| AWD automatic | 22% | 365 hp | Most performance AWD sedans and crossovers land here. |
| 4WD truck, transfer case | 25% | 380 hp | Two hypoid axles, a transfer case, and heavy wheels at all four corners. |
Look at the spread: the same dyno sheet supports anything from 317 to 380 hp depending purely on which row you pick. 63 horsepower of assumption — more than most bolt-on parts deliver. That is why the drivetrain field matters more than the decimal places on the dyno printout. Gearing changes the picture too; swapping to a numerically higher final drive puts more torque multiplication through the same hypoid mesh, which our gear ratio calculator will size for you before you order a ring and pinion.
Why Doesn't a 700 whp Car Lose 15%?
Here's the part almost every drivetrain loss page gets wrong, and it's the reason the calculator above includes a scaling table. A flat percentage is a convenience, not physics. Bearing preload, seal friction, gear mesh and oil churn are all roughly constant torque losses at a given road speed. Your pinion bearing does not start dragging twice as hard because you bolted on a turbo.
Take our car: 285 whp, 335 hp at the crank, 50 hp of drag. Now build it to 570 whp. Under a flat 15% you'd claim 670 hp at the crank — implying the drivetrain suddenly eats 100 hp. It doesn't. Absolute loss climbs somewhat because the gear teeth are carrying more load, but nowhere near double. Hold the drag steady at 50 hp and the honest figure is 620 hp, an effective loss of 8.1%:
| Wheel power | Effective loss | Crank hp, 50 hp drag | Crank hp, flat 15% | Overstated by |
|---|---|---|---|---|
| 285 whp — stock | 15.0% | 335 | 335 | — |
| 430 whp — bolt-ons | 10.4% | 480 | 506 | 26 hp |
| 570 whp — built | 8.1% | 620 | 671 | 51 hp |
| 855 whp — serious | 5.5% | 905 | 1,006 | 101 hp |
Reality sits between those two crank columns, because absolute drag really does creep upward with torque — but it sits far closer to the constant-drag side. Which means the four-digit crank numbers thrown around in build threads are usually a flat percentage doing the heavy lifting. A car that genuinely puts 855 hp to the ground is a 900-something engine, not a 1,006 hp one, and the person quoting 1,006 isn't lying so much as using the wrong model.
The effect runs the other way at the bottom of the range. A 95 whp economy car carrying 13 hp of driveline drag is losing 12% before anything unusual happens, and a heavy classic with tall gearing and a cold axle can lose more. Low-power cars pay the percentage penalty; high-power cars enjoy the discount.
A Dyno Sheet Lies Twice Before Drivetrain Loss Enters
Correcting for the drivetrain only fixes one of three variables, and the other two move further than most people assume.
The correction factor. Ambient air changes what an engine can make, so dynos normalise the result. SAE J1349 — the SAE net power standard manufacturers certify against — corrects to 29.23 inHg of dry air at 77°F, and applies that correction only to the 85% of output the weather actually affects, on the assumption that the other 15% is mechanical friction. The older STD factor corrects to 29.92 inHg and 60°F. The same pull, printed under STD, reads roughly 4% higher: our 285 whp becomes about 296. If you don't know which factor produced your number, you don't know your number.
The dyno itself. An inertia dyno such as a Dynojet computes power from how fast the car spins a known drum mass. A load-bearing dyno holds the car at a controlled rate instead. They routinely disagree by 5–10% on the same car in the same afternoon, and neither is wrong — they measure different things. Strap tension, tyre pressure, roller slip and heat soak between pulls each move the result a few horsepower on their own.
Which leads to the short list of times a corrected crank figure is the wrong tool:
- Comparing two cars dynoed on different machines. The drivetrain correction is the smallest source of disagreement in that comparison, not the largest.
- Hub dynos. Bolting to the hubs removes the wheels and tyres from the measurement, so a big slice of the loss you're correcting for was never there. Using 15% on a hub-dyno number double-counts.
- Judging a tune. Before-and-after on the same dyno, same day, same correction factor is the honest measurement. Convert to crank hp afterwards for conversation, never for tuning decisions.
- Feeding a performance estimate. Trap speed and ET follow the power that actually reaches the road, so give our quarter mile calculator your wheel figure — a crank number will flatter your car by several tenths.
If you want your car's real number rather than a table's, ask the shop for a coastdown: after the pull, the operator declutches and lets the drivetrain decelerate the rollers, and the software back-calculates the drag it just measured. It isn't perfect — it captures the loss at falling speed with no torque loaded through the gears, so it tends to read slightly low — but it beats a percentage someone else picked. Pair it with a healthy engine underneath: a build that's down on compression ratio loses power at the crank, long before the gearbox gets a chance to take its share.